Showing 1–12 of 27 results
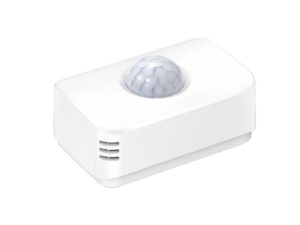
SKU: NB007-PIR
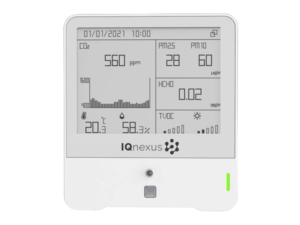
SKU: NB307-AQI-3M-LR
SKU: NB319-AQI-5M-LR
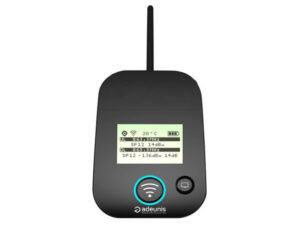
SKU: Adeunis-Field-Test-Device
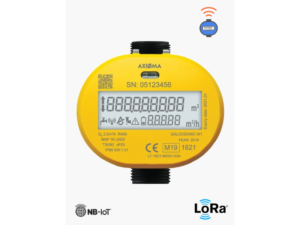
SKU: Axioma QALCOSONIC W1
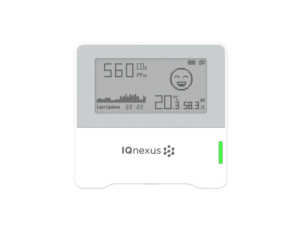
SKU: NB103-CO2-LR
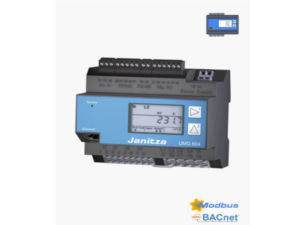
SKU: Power Analyser UMG 604-E PRO
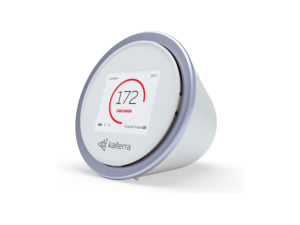
SKU: Kaiterra Laser Egg + CO2
SKU: Kaiterra-Sensedge
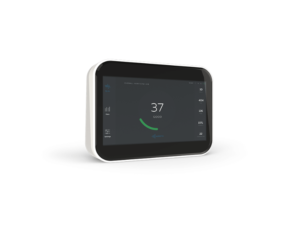
SKU: Kaiterra-Sensedge-Mini
SKU: SenDigi-3DI-3A-LR
SKU: SenAir-CO2-3C-LR