Irrigation
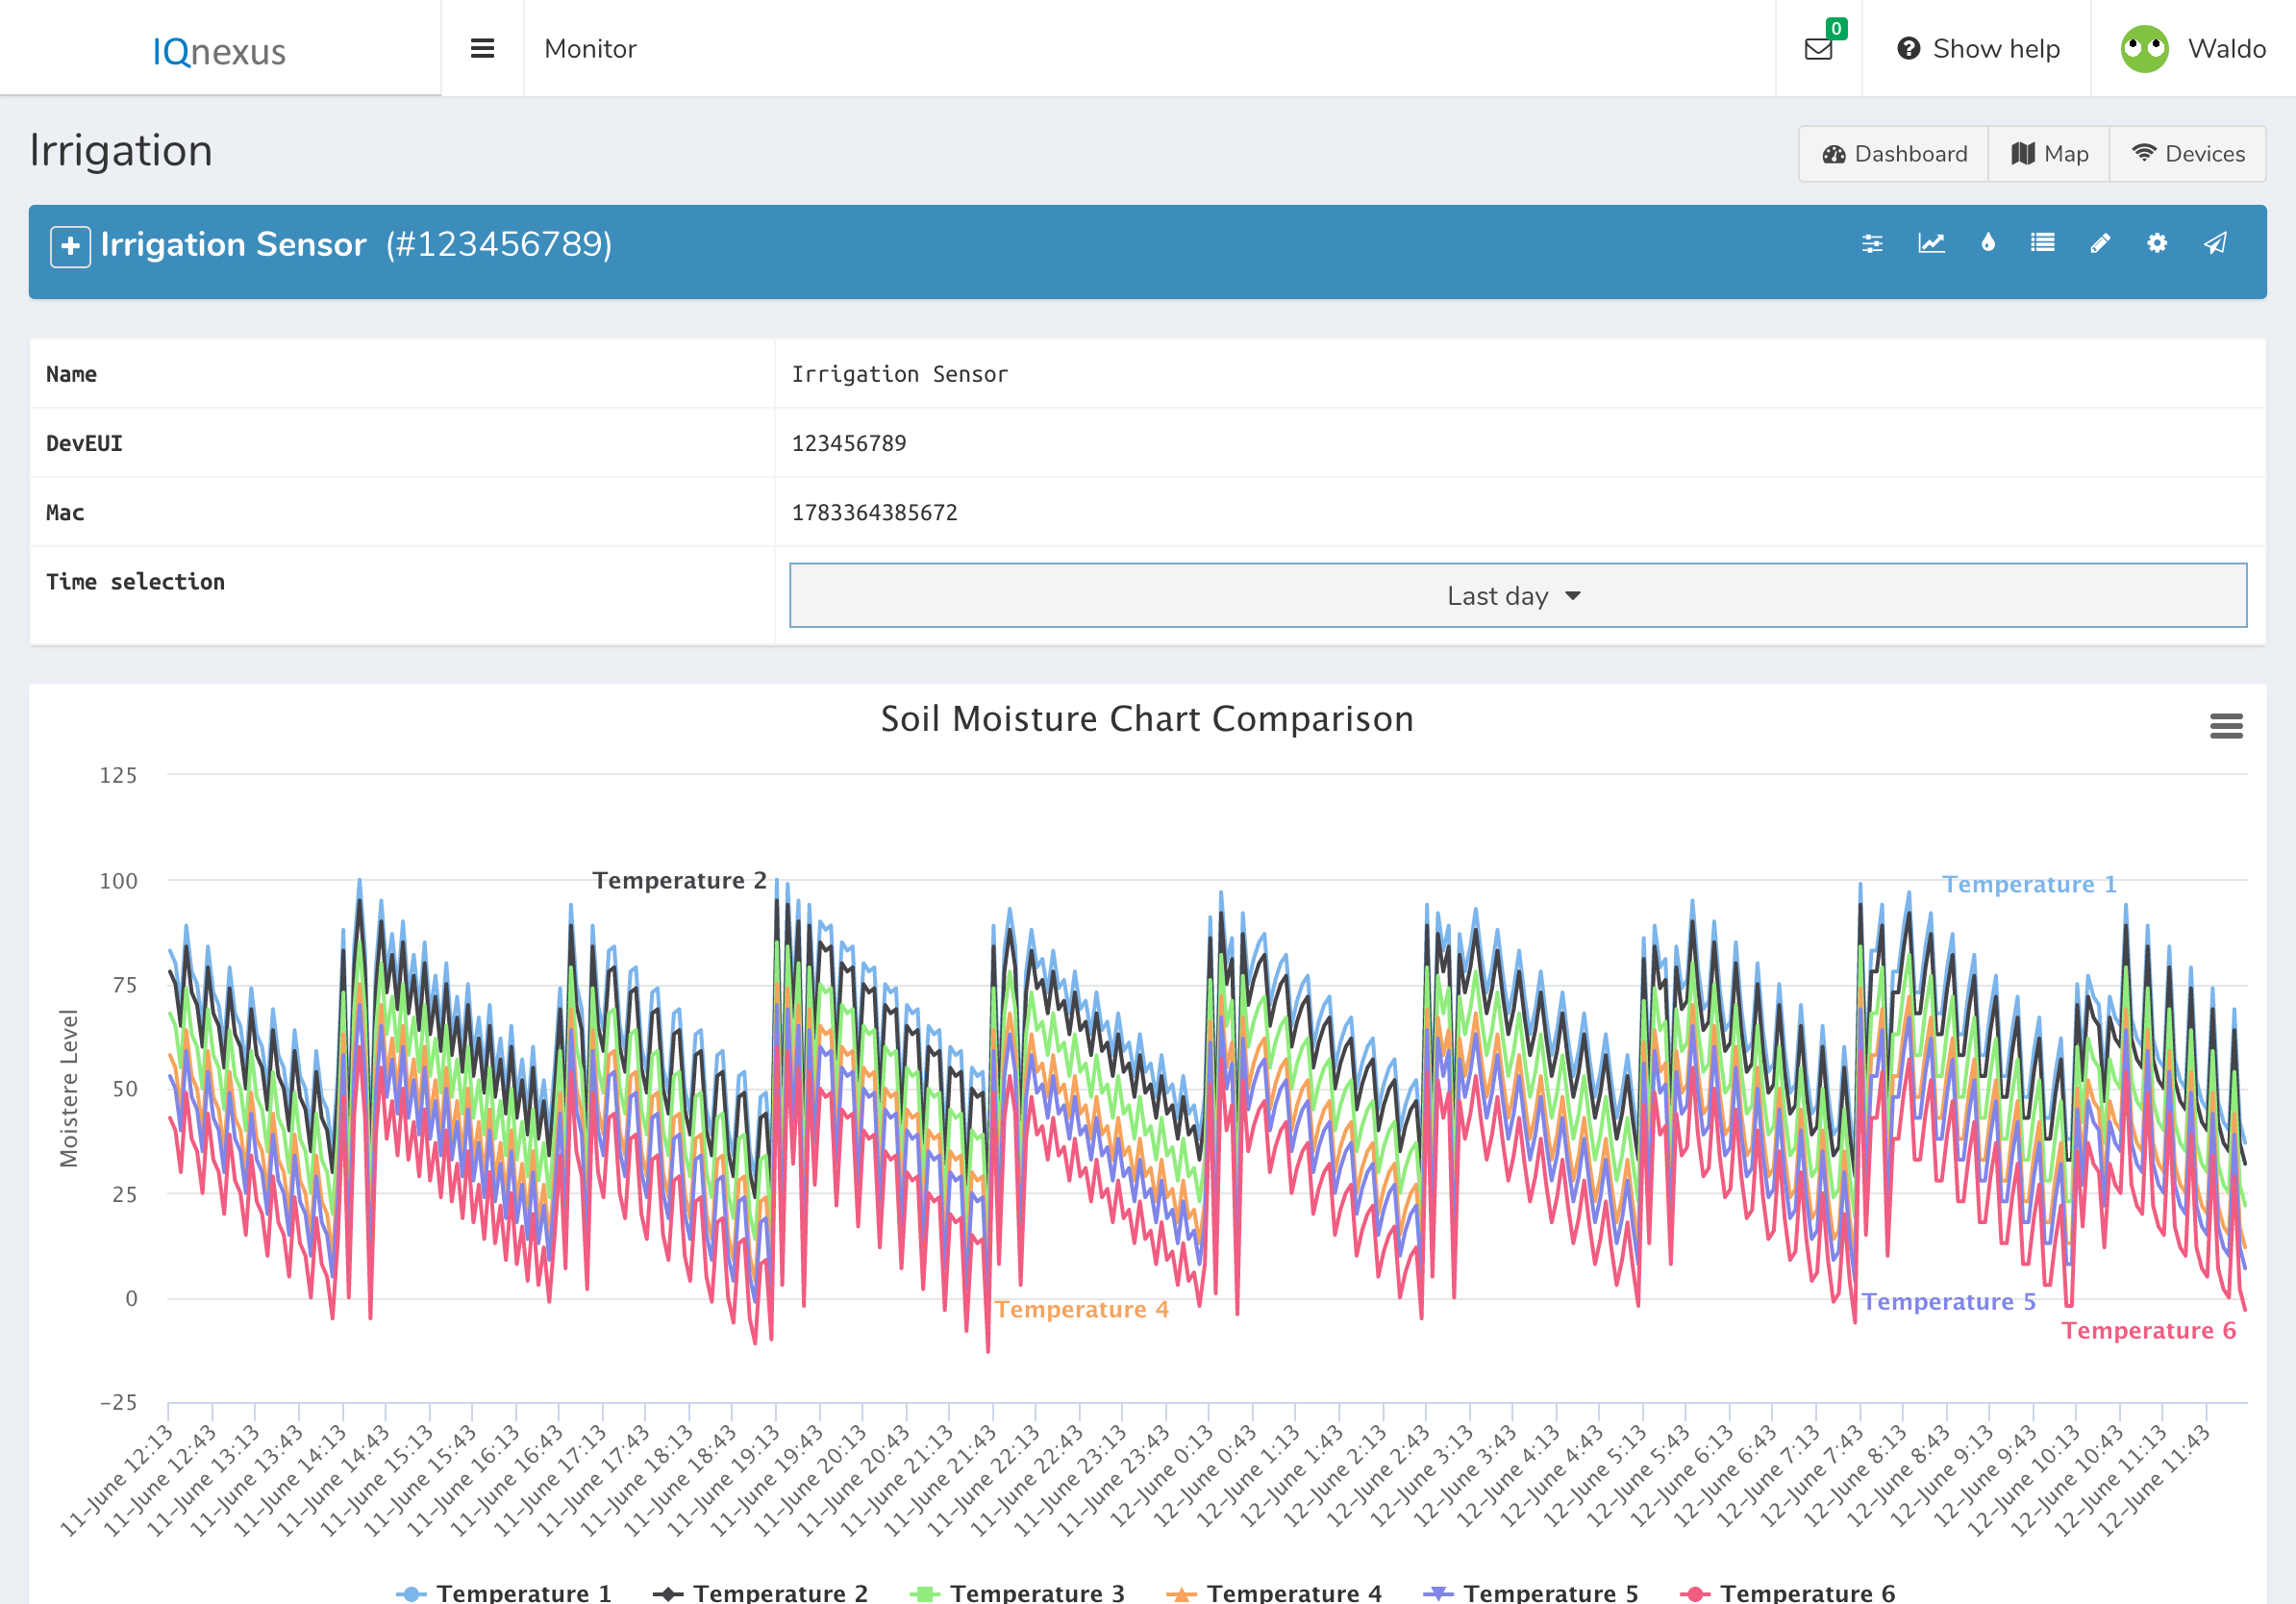
If you have a SenProbe sensor, or any senor that measures the moisture level at specific levels, you can use the special plotting stats screen. For this, you will need a supported driver. Make sure that the driver that you are using has the tag ‘irrigation’ set(Developer menu on the left-> drivers -> edit your driver -> tags). When setup correctly, you will get 2 new plotting screen. The first being the soil moisture chart comparison screen, where you can see all the moisture at different height levels:
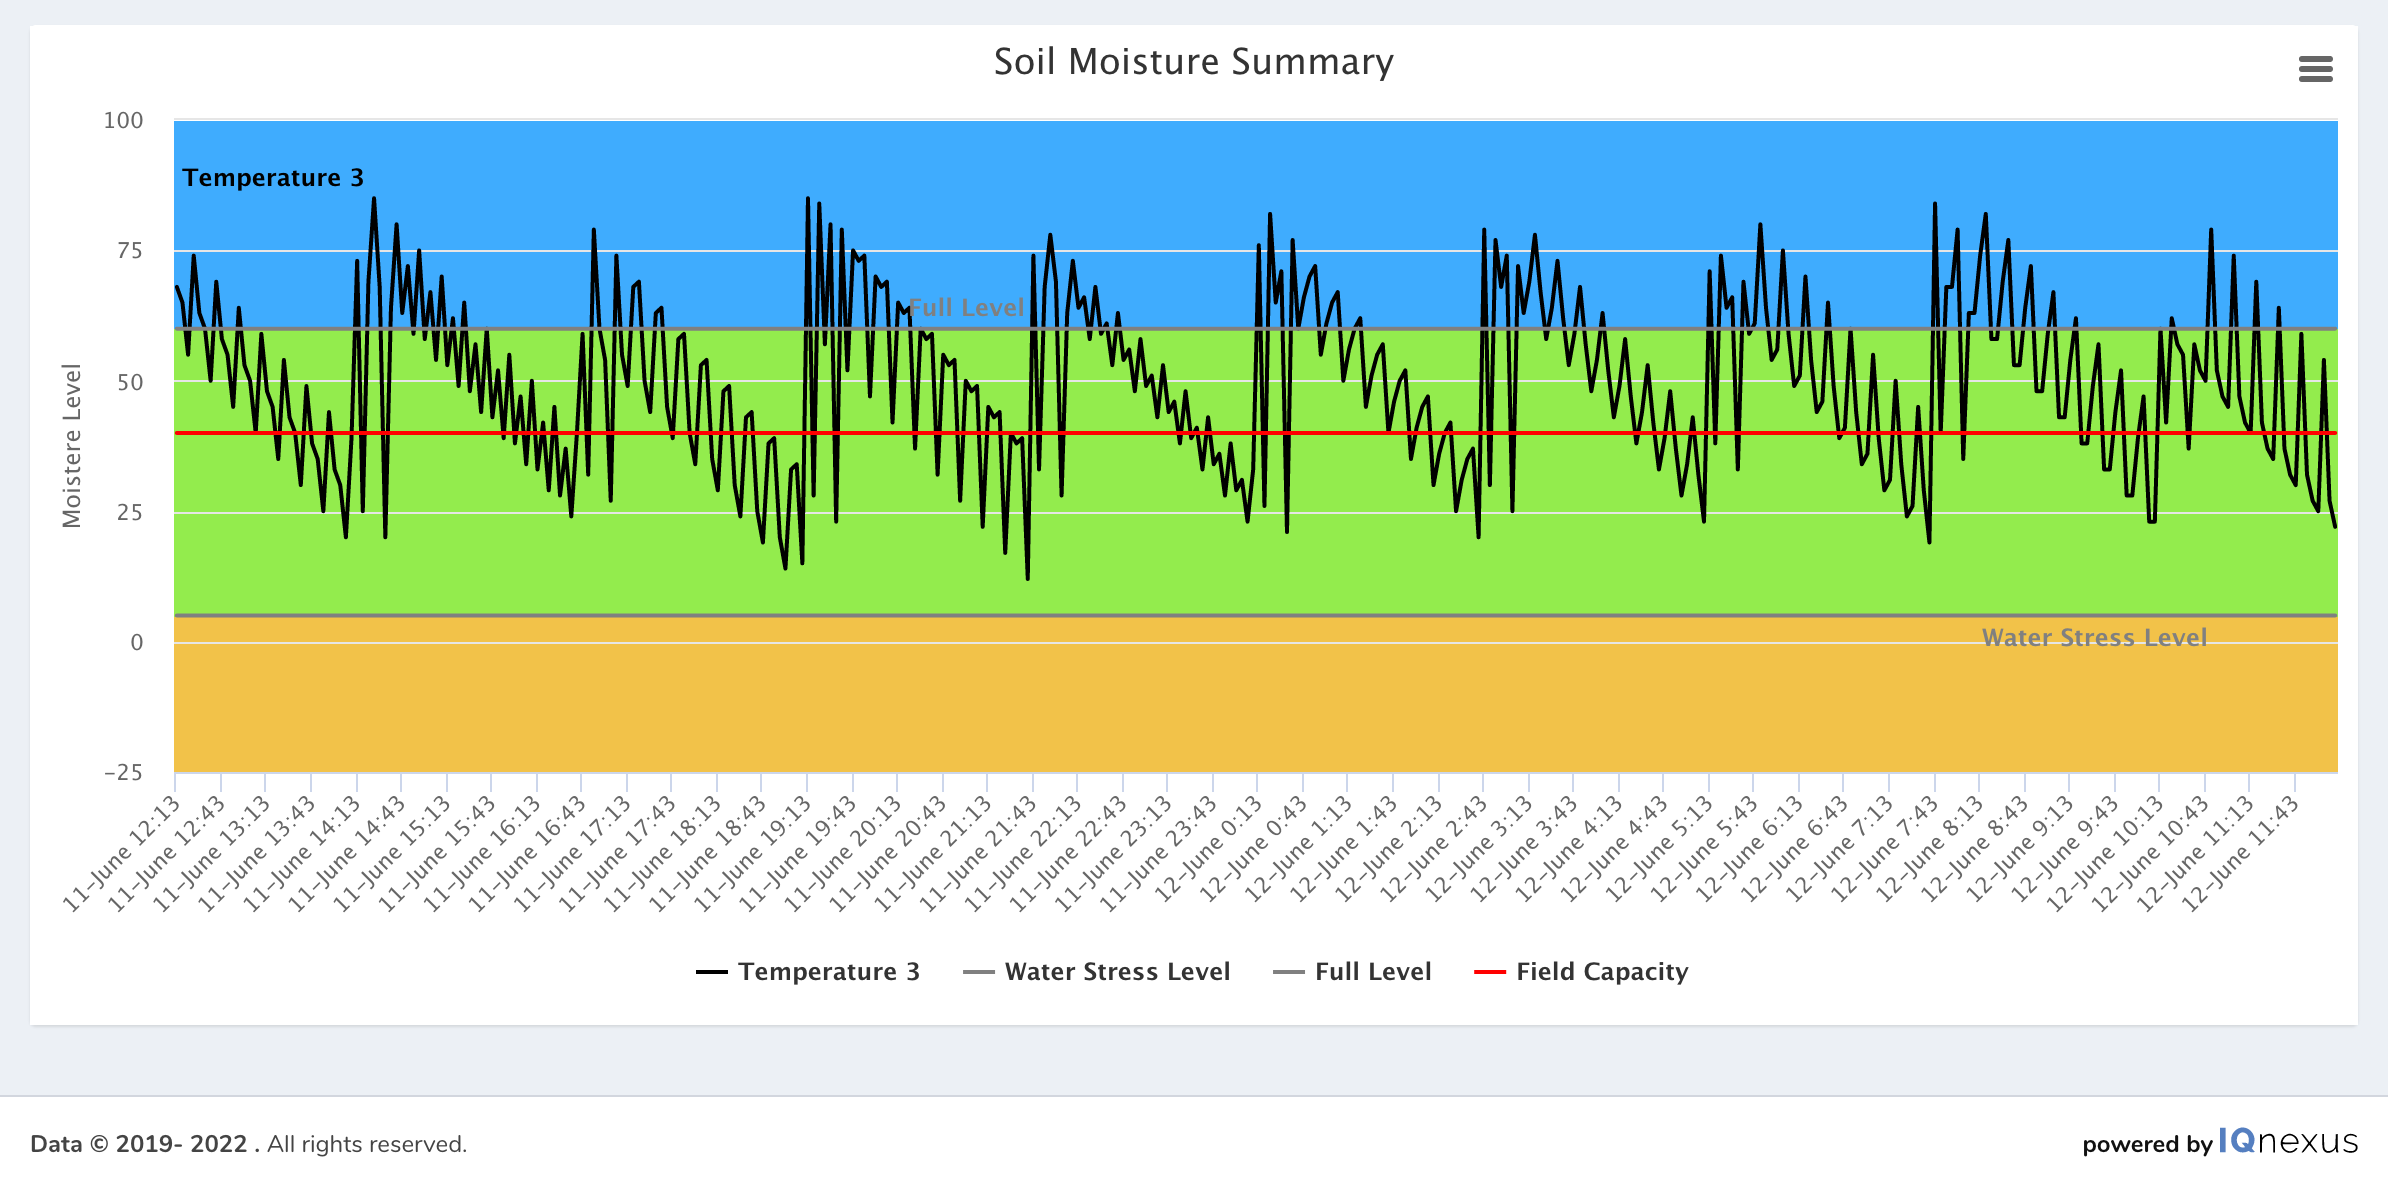
And on the the second plotting you can see the average report and determine if you need to take action:
To use this, make sure your driver has the exact tag ‘irrigation’ set. Create a new device and go to the device setup. There should be another tab for ‘Irrigation Settings’:
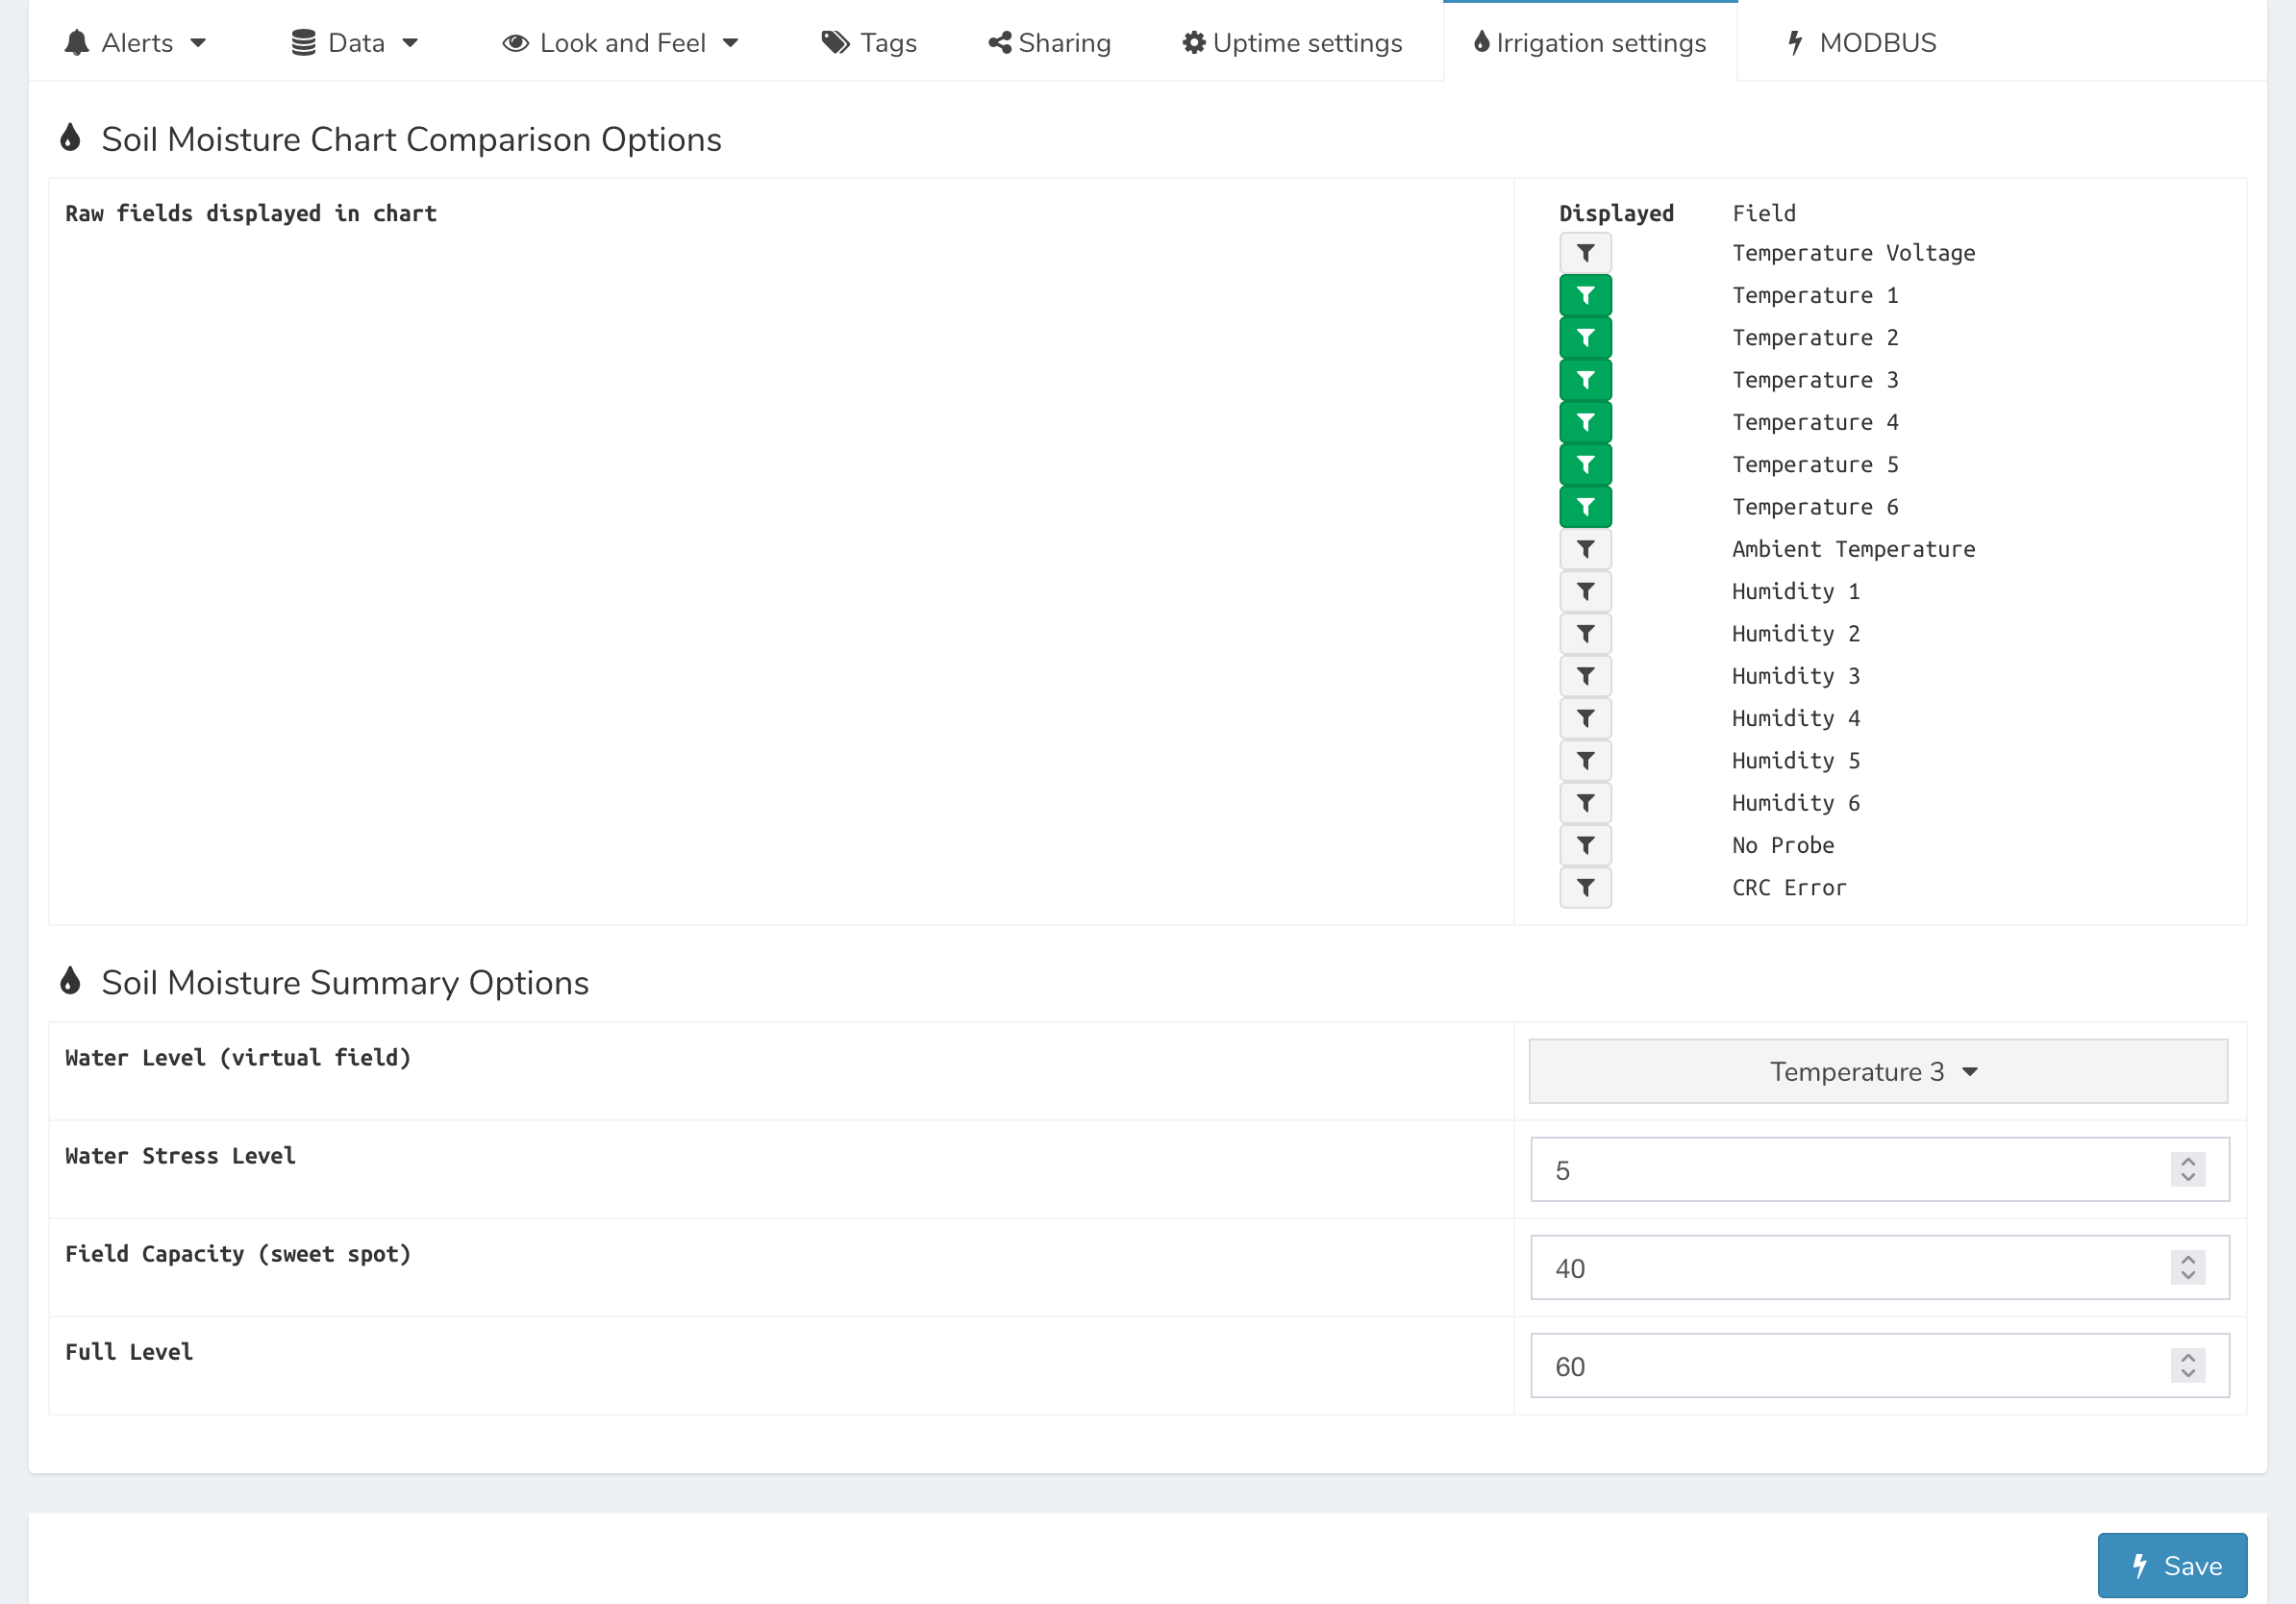
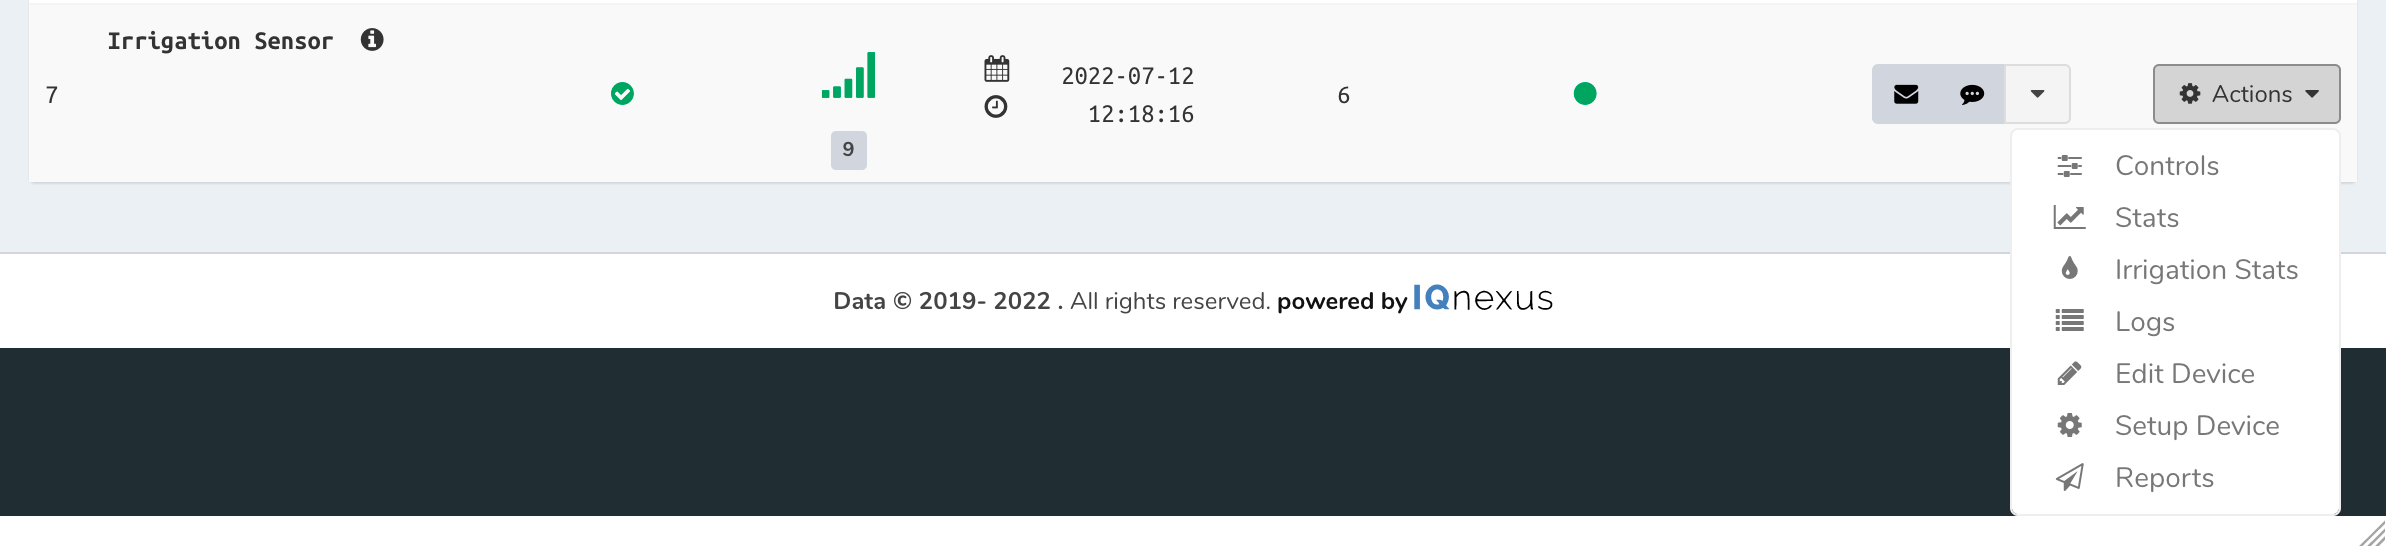
For the soil moisture chart comparison we can select the fields that we see on the plotting screen. These will be the raw fields that indicate the moisture level per height setting. For the soil moisture summary we can select the fields that we use for the average. Either you already have a field for this or you can create a virtual field. We can also set the stress level, so the minimum water level, we have the field capacity which should be the ideal water level and we have the full level, when the plant wont use any more water that it is given. To see the plotting, the device will have another menu in the action menu for ‘Irrigation Stats’: