How to view your device’s data
Your device transmits data readings over an Internet of Things Network to the IQnexus Platform which then processes and displays this data in an easy to interpret format.
Data can be viewed in two ways. The first is Stats; a graphical view where you can visually interpret the data change. The second is logs; a time sorted list where you can see each data point in detail.
To enter data viewing, navigate to your device and select Stats/Logs from the Actions menu to the right of the device.
Stats
Remember to click Save, to save your plotting settings for next time!
The stats data view is great for visualising trends in the data over time.
The graph is easily scaled to view over a period of one hour to a whole year or enter a custom range all from the view bar at the top of the graph.
Drag and select an area on the graph to zoom in on this area.
View settings menu
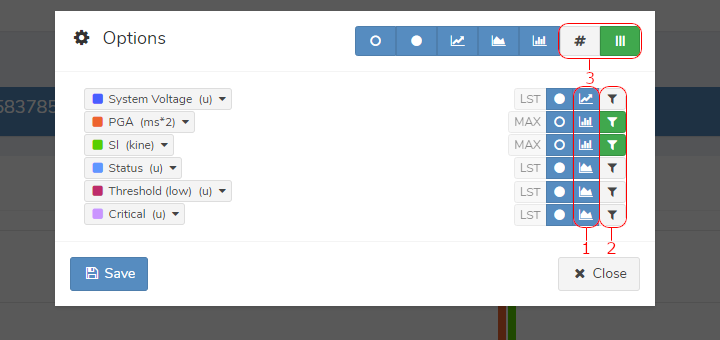
-
Changes the graph type. Can be a Line, Area or Bar graph
-
Filters the data values displayed. Green values will be displayed.
-
Choose to display the raw value near each data point and whether to have multiple axes. Multiple axes are very useful when data is in a very different scale and makes the smaller values easier to view.
An easy way to see more detail and additional data points is to select a data point on the graph. This shows the exact data value and time of recording as well as a list view of near by readings below. This data can also be downloaded in CSV format.
Logs
Logs are useful when you want to see all the available data as well as network information. Each time data is received, a new entry is added to the logs page, showing the data in each field as well as other information like signal strength, location and time stamp. The log is always ordered with the latest data at the top.
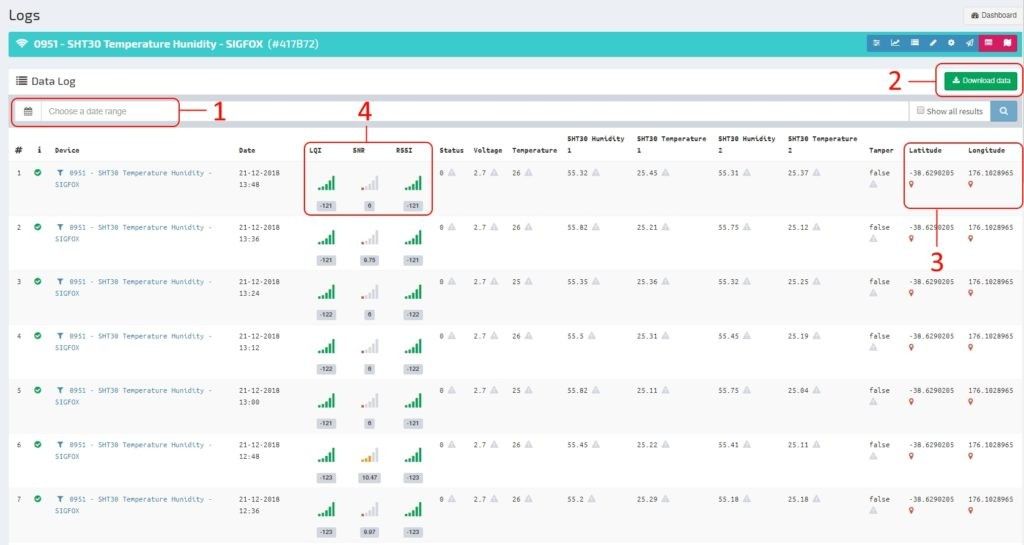
-
25 points are displayed per page by default, starting with the latest received data. This is easily changed by simply setting the desired range you wish to view with the choose date range option.
-
The download data button, will download a CSV file of the currently displayed data. Only data logs that are displayed at the time will be downloaded. If you wish to download and display more data, you will need to define a date range and tick show all results next to the search button. Once again, click on download data to download the new data set.
-
This area shows the location of the device. If the device has a GPS module, then this location will be updated, otherwise it will remain at a set position which is defined when initialising the device.
-
The strength and quality of the signal at the time of transmission can be seen here.