How to set up a monitoring project
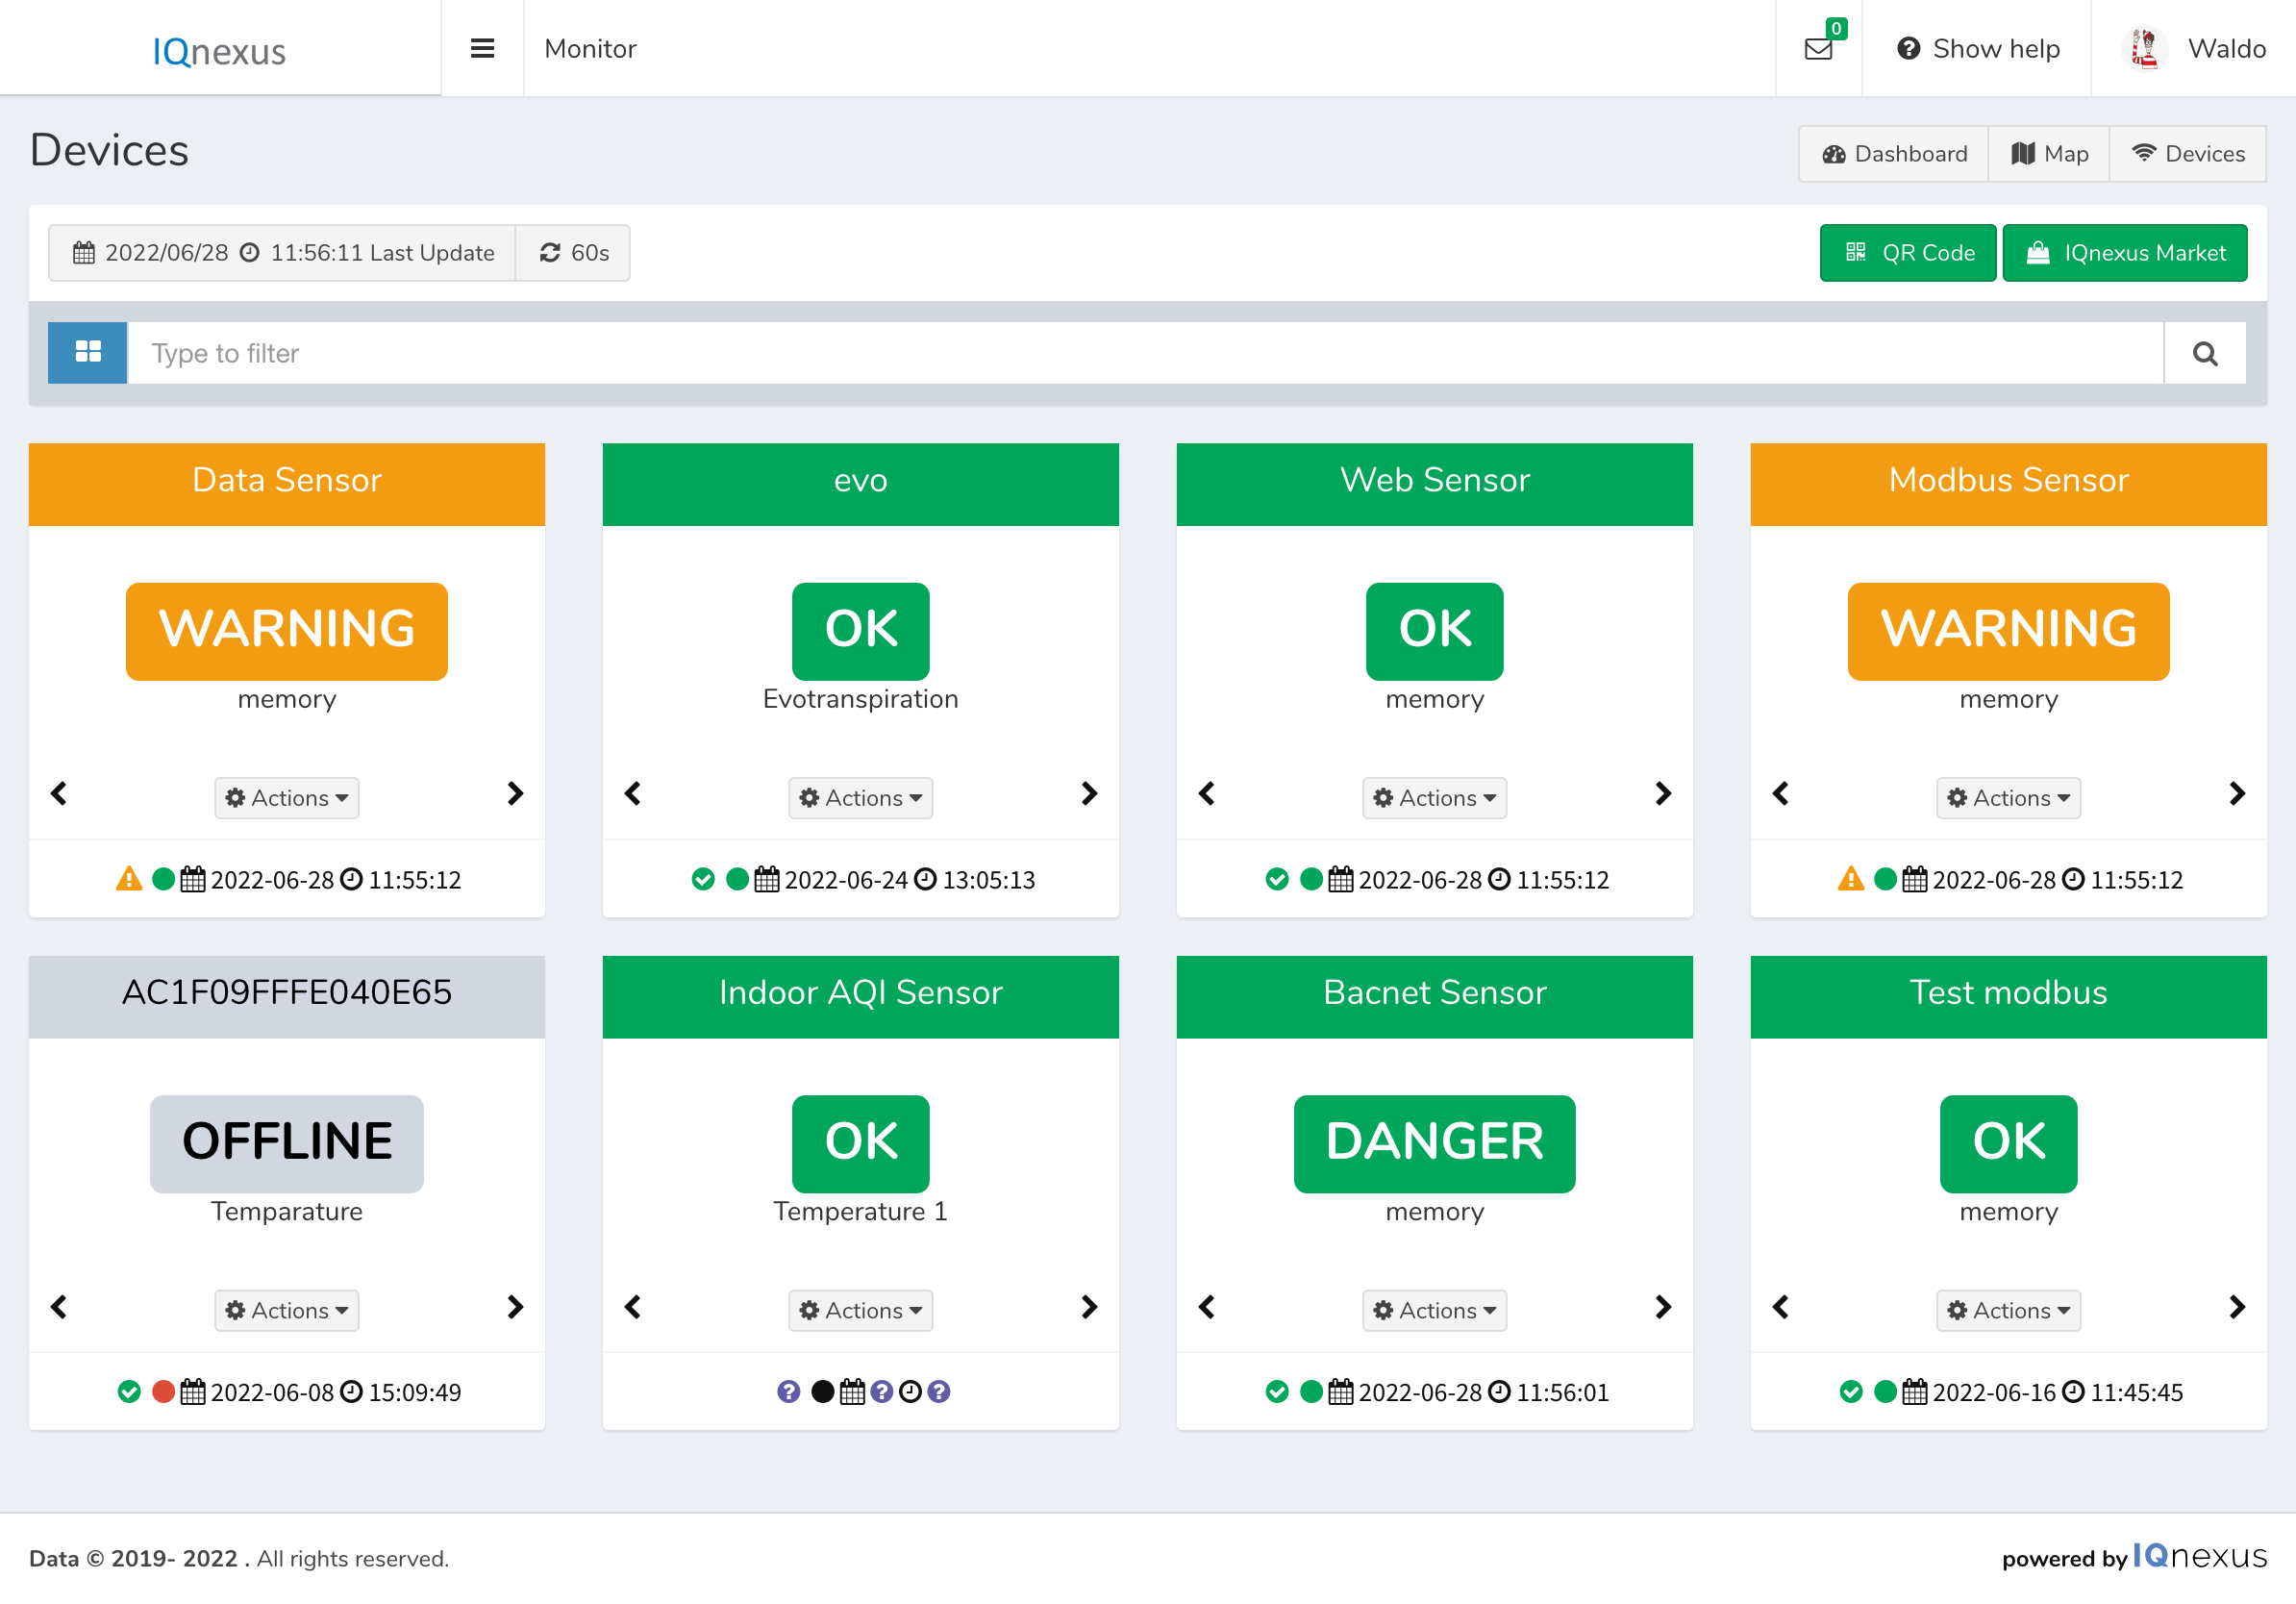
A common use of a collection of sensor readings is to monitor values, ensuring they are within a range deemed acceptable or safe. The platform is user configurable and this article will show you how to configure your project to watch the values of your device on one screen, as well as be alerted visually and via email etc. when the values deviate from the acceptable range
Set the acceptable range
The colour of the panel will change if any one of the values is outside the acceptable range. If you only want to monitor one specific value, leave the other values with their maximum and minimum values set as normal upper and lower, respectively.
-
Navigate to the device and select Actions → Setup Device
-
Follow the steps to set alert thresholds, on the value(s) you want to monitor.
This will control the colour change and email/txt alerts when a value deviates from the acceptable range -
(Optional) Click Alerts → Link Status and set the accepted time period for a device to be disconnected from the network before it is considered a Fault. When it is considered a fault the Card will turn grey.
Set the card view Look and Feel
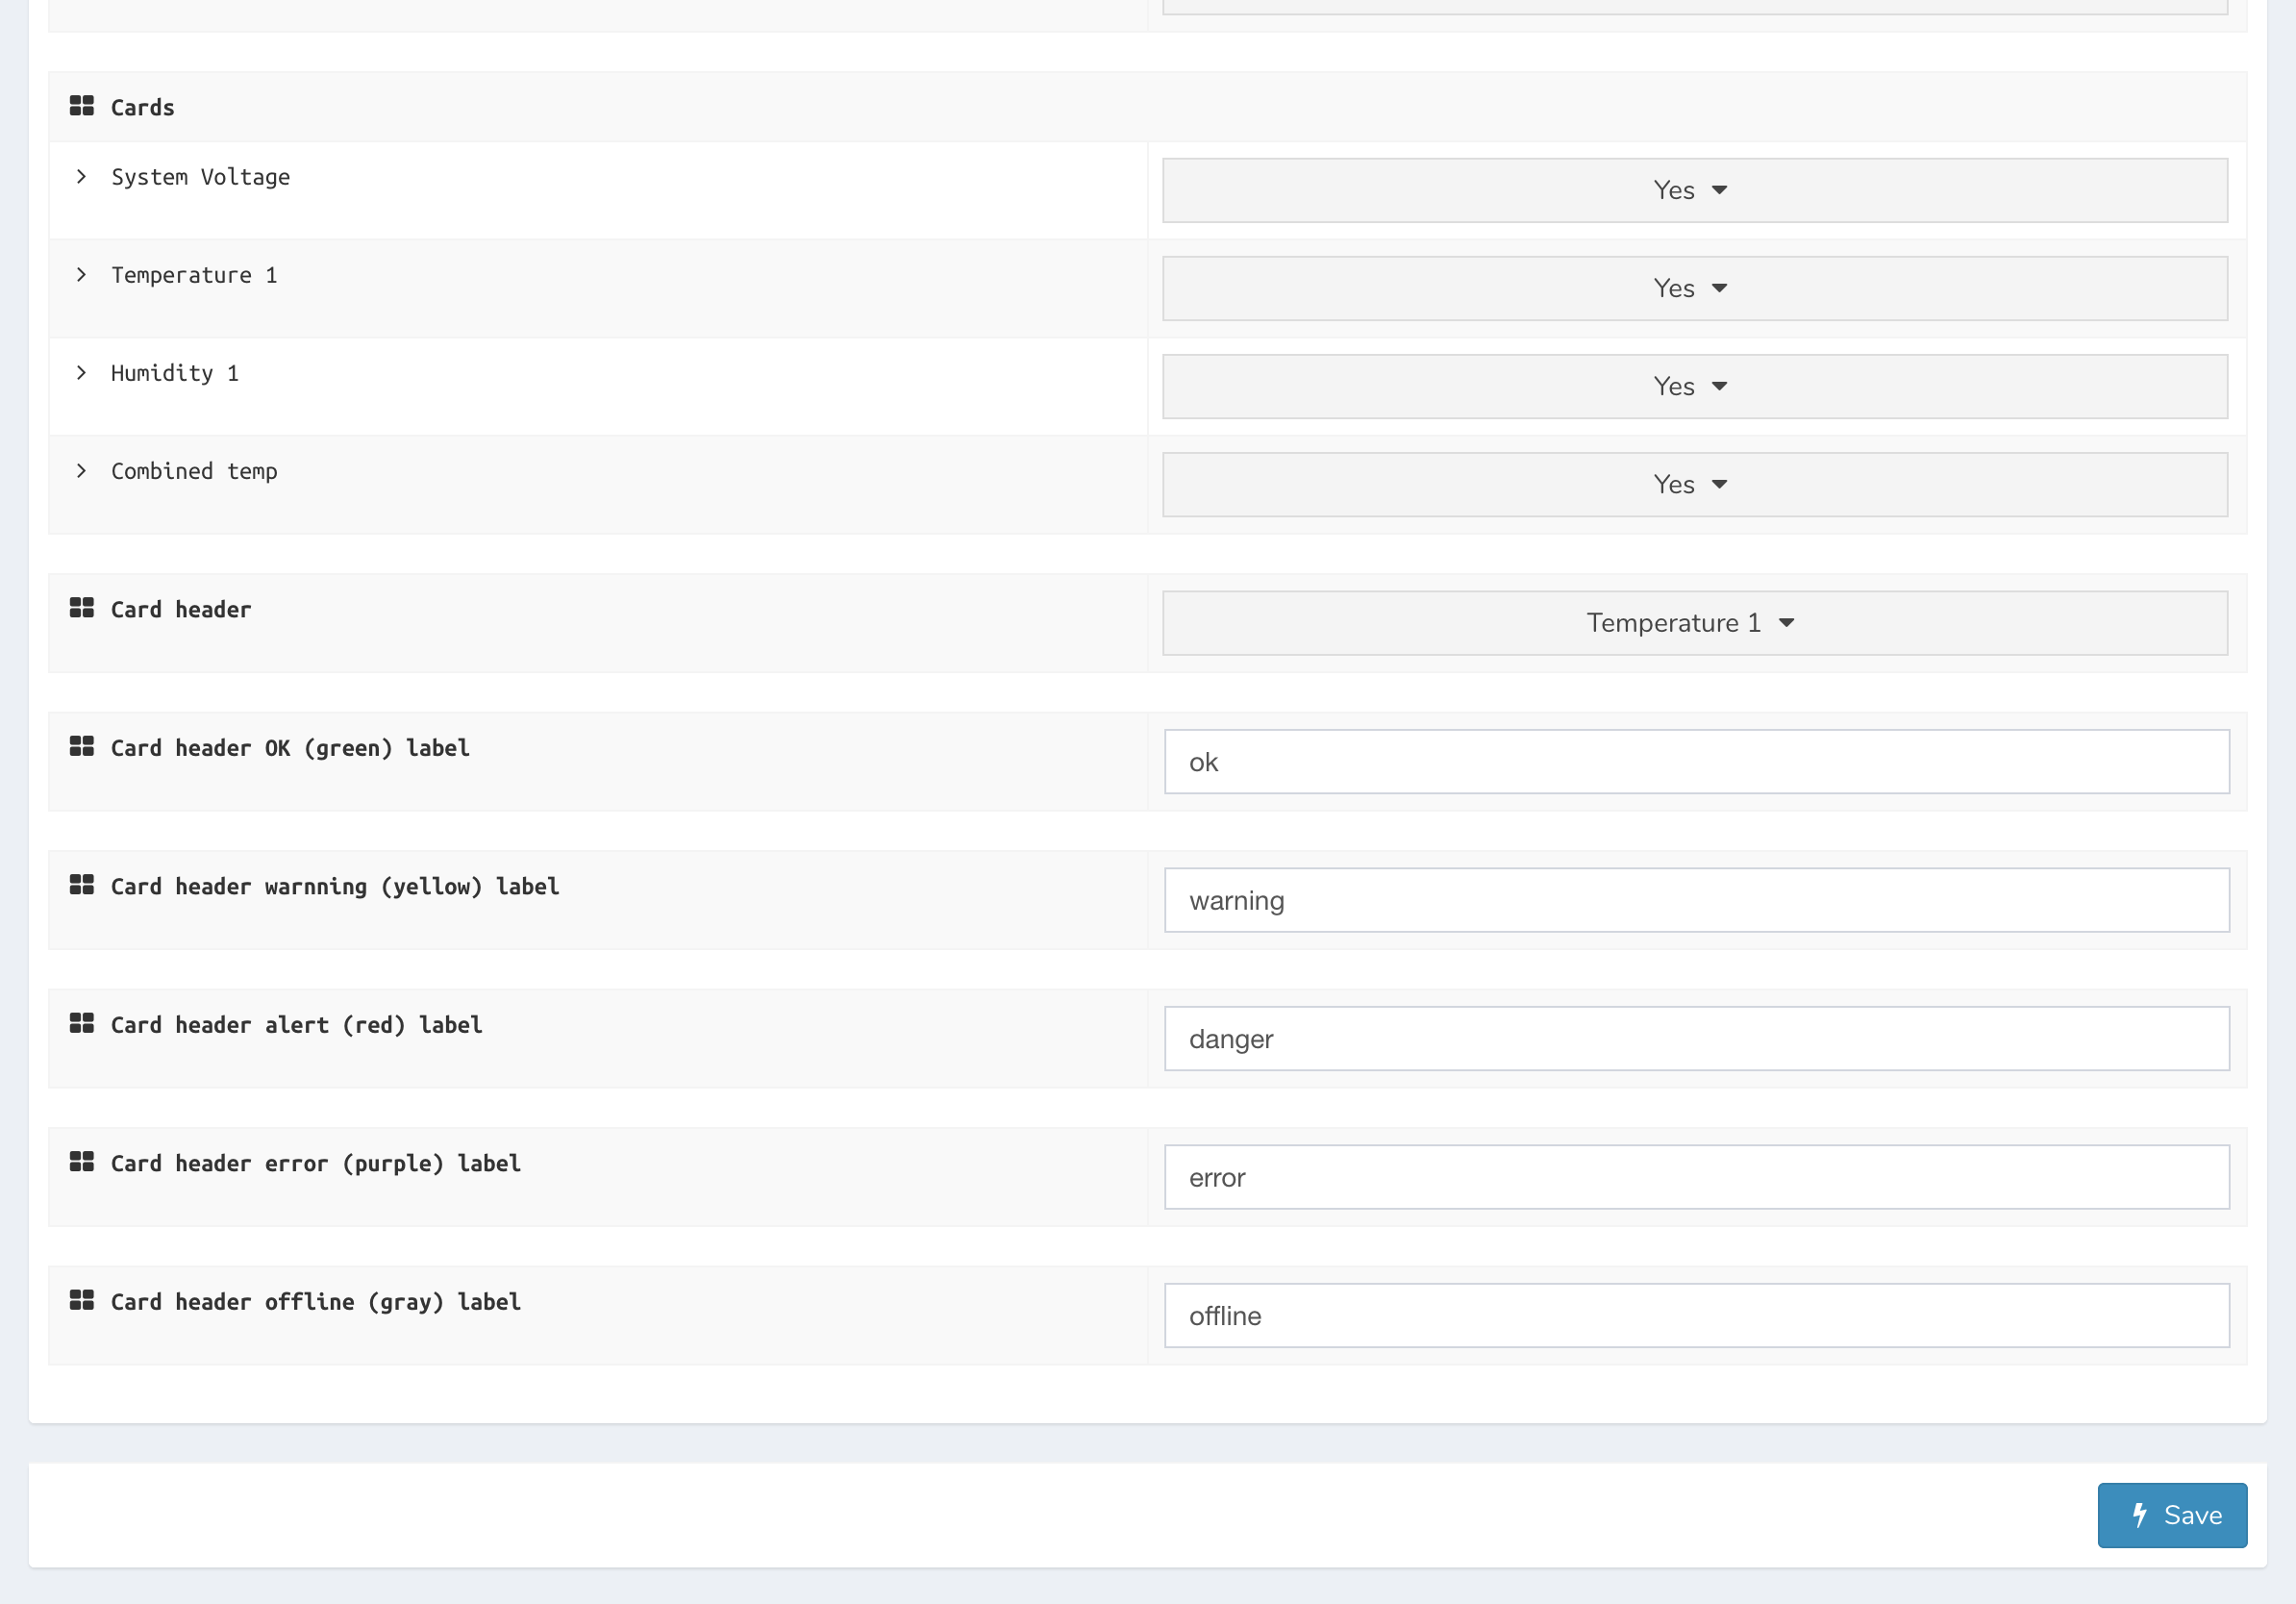
Make sure you set a Card header value for each card. The Card header value is the value which sets the colour of the Card. For example, if system voltage was set as the Card header and was within the normal range, but the temperature was outside the normal range, the Card would remain green. The link status will override the value alerts, as the data is considered invalid. i.e. regardless of the data, if the link status is in Fault the Card will turn grey.
-
Select Actions → Setup Device, then Look and Feel → Panel
-
Set values as Favorites, which will show together in a mini table as one panel of the card, or Cards, which will be shown as their own panel.
-
Finally, set the displayed text when each status is detected, e.g. Offline (grey) label could be left as “Offline”
Set the cards view as your Dashboard
You must be a project administrator to set the default settings of the project, like your dashboard.
-
From the main navigation menu accessed by the menu icon in the top left, Select Project → Project
-
Change Homepage to data/devices
-
Select Module configuration → panel
-
Set the Refresh time and set Display Mode to Cards
-
Finally, in the devices window, click the Cards icon beside the search field, to enable the view.
